
Statistics Density
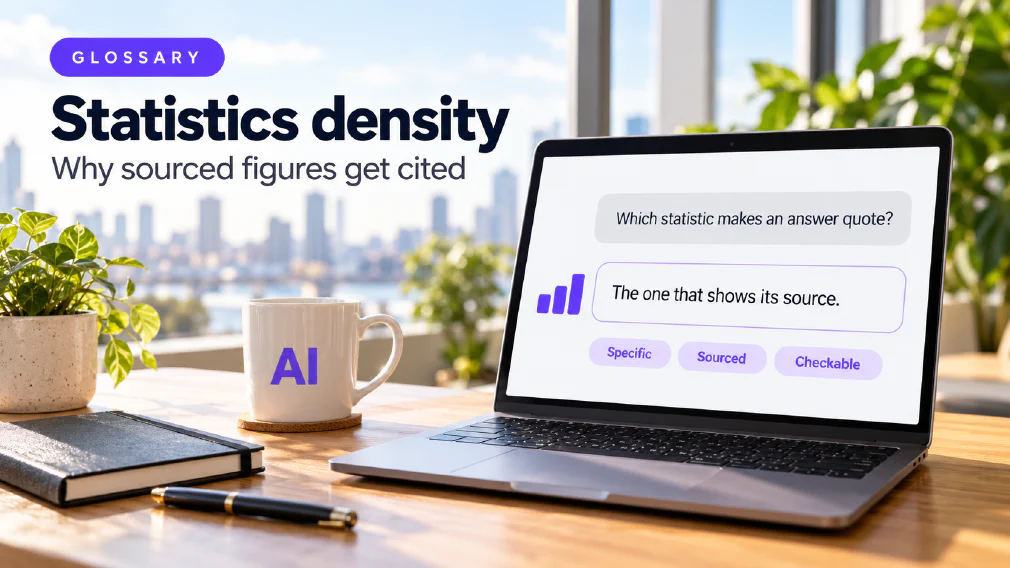
How much specific, quantitative data a page carries compared with general assertion. In the peer-reviewed study the site's citation article describes, adding statistics produced the largest single gain of nine techniques tested, a 41% increase in AI visibility.
What statistics density means
Statistics density is how much specific, quantitative data a page carries compared with general assertion. It is a plain idea. Two pages can make the same point, and one of them backs it with a counted, dated, attributed figure while the other only says it is so.
The term matters because of one finding. The citation article describes a peer-reviewed study that tested nine content techniques against AI-generated answers. Adding statistics gave the largest single gain of the nine, a 41% increase in AI visibility. The study did not reward a page for being longer, more persuasive or better optimised for a phrase. It rewarded a page for carrying something an answer could rely on.
This page defines the term, shows what the study found and what it did not, and sets out how to raise a page’s statistics density without writing more than you already have. The wider picture of being named as a source is on the AI citation page.
Why does a sourced figure get cited more than a claim?
The citation article gives the reasoning. Systems built on a large language model behave in a risk-minimising way. They prefer content that offers something specific and checkable over content that offers only general assertion. A model assembling an answer has to stand behind each thing it repeats, and a sourced figure is easier to stand behind than a claim with nothing under it.
The article’s example is deliberately small. A page that says adoption is increasing is less citable than one that says adoption rose by a specific, sourced percentage. The second sentence can be lifted into an answer as written. The first has to be reworded, and a model that rewords a vague claim risks getting it wrong.
The ranking article makes the same point from another angle. A model choosing what to cite is doing extraction work, not composition. It reaches for whatever it can lift without reinterpreting. A figure with its source beside it is exactly that kind of material.
What did the study actually find?
The citation article describes a benchmark of roughly 10,000 queries across nine content domains, run through a simulated generative answer pipeline with citations, with the strongest findings checked on a real assistant afterwards. Three of the nine techniques produced the largest gains:
- Adding statistics improved AI visibility by 41%, the largest single gain.
- Adding direct quotations improved it by 28%.
- Citing external sources improved it by 115% for lower-ranked content specifically.
The article’s observation is that the three share a thread. Each adds verifiable, attributable information instead of restating a claim more persuasively. Fluency, meaning clean and well-structured writing, added a smaller lift, and fluency paired with statistics produced the largest combined effect of any pairing tested.
Two findings point the other way. Keyword stuffing produced negligible or outright negative effects, and adding more words on their own produced no improvement. The article reads this as good news for smaller organisations: the techniques that work are additions to existing pages and not a requirement to publish far more.
How is it Different from keyword density and word count?
Statistics density is often mixed up with two older habits, and the study separates all three.
Keyword density is how often a target phrase is repeated. It was treated for a long time as a signal in its own right in conventional search. The study found that packing content with repeated phrases did nothing useful for AI visibility and sometimes reduced it.
Word count is how long the page is. The study found that length alone is not what AI systems respond to.
Statistics density is how much specific, checkable information each stretch of the page carries. It is the only one of the three the study found to move citations by a large margin.
The practical difference is the direction of the work. Raising keyword density or word count means writing more of the same. Raising statistics density usually means replacing a vague sentence with a precise one, which often makes the page shorter.
What counts as a statistic worth adding?
A figure earns its place if it is specific, quantitative and attributable. A percentage, a count, a date or a measured comparison can all qualify, provided you can say who measured it and when. A number with no origin does not qualify, because it is no easier to stand behind than the claim it replaced.
The same test separates the three techniques that worked from decoration. A direct quotation from a named source is specific and attributable in the same way, which is why it scored 28%. A citation to a credible external source gives the reader and the model a place to check. In each case the addition is information that can be verified, and not a stronger-sounding version of the original claim.
This is also why the term sits well beside E-E-A-T. The AI Overviews article says being chosen as a trustworthy source is a precondition for being cited at all. A sourced figure is one of the plainest ways a page shows its trustworthiness on the page itself.
How should a figure be written on the page?
The pages on this site follow one habit, and it is worth copying. The figure is stated, the research or guide it comes from is named in the same sentence, and a verb such as “reports” or “found” tells the reader it is someone else’s measurement and not an opinion. The table below shows the difference using figures the site already publishes.
| General assertion | Specific and sourced |
|---|---|
| Few workers have had formal AI training. | Only 19% of workers have been through a formal AI programme, according to research the training article cites. |
| Brand mentions matter for AI visibility. | Brand mentions correlate roughly three times more strongly with AI visibility than backlinks do, at 0.664 against 0.218, according to the citation article. |
| Clicks fall when an AI summary appears. | People clicked a traditional result in 8% of visits when an AI summary appeared and in 15% when it did not, in a study of 68,879 Google searches that the SEO against GEO review reports. |
Notice what the right-hand column leaves out. It does not round the number into vagueness, and it does not claim more than the source does. Where a figure is a correlation, it says so. Where it comes from one study, it says that too. A model repeating the sentence repeats the limits with it, and a reader checking it can find the source in a minute.
Why must every figure carry its Source?
Because a figure without one is a risk, not an asset. The SEO and GEO comparison states the condition plainly: keep figures sourced, because an assistant can only repeat a number with confidence if the page shows where it came from, and a reader checking it needs the same. Assistants are built to give answers grounded in sources they can point to, so a page that shows its sources plainly is easier for them to use and safer for them to repeat.
The comparison puts this as a step in its order of work: source every figure, with the fact and its origin together. That placement is useful. It comes after the foundations and after making each answer self-contained, and before tracking. It is a habit applied to a page that already works, not a project.
A figure that cannot be checked also does harm to the rest of the page. If one number turns out to be wrong or unsupported, a careful reader, and a careful system, has reason to trust the other numbers less.
Where should the figures go on a page?
Near the top, and in a form that can be lifted. The ranking article cites a published guide reporting that opening paragraphs which answer the query immediately are cited 67% more often, and that pages carrying original data tables earn 4.1 times more citations than pages making the same claim in prose. A separate study it reports found that 55% of cited passages came from the first 30% of the page.
These are reported associations and not guarantees, and the AI citation page says so. They still give a clear editing rule. Put the direct answer first, put the figure and its source next to it, and turn any comparison into a labelled table. That is the structured content habit, and statistics density is what you put inside the structure. A well-laid-out page with nothing specific on it gives a model very little to lift.
Which pages should get the pass first?
The citation article gives a clear order. Start with pages that already perform reasonably well under conventional search, since those are best placed to benefit first. Add specific, sourced statistics and credible external citations to them.
Then do not write off the weaker pages. The 115% figure applied to lower-ranked content, and the article calls it the clearest evidence in the study that this is not simply a game that rewards whoever was already winning. A page that never reached the top three, but carries clear figures, cites credible sources and reads cleanly, competes on different terms than it would in a list of results.
This is why the content strategy question changes. The effort moves away from producing more pages and towards making each existing page easier to rely on. For a small team that is a smaller job than it sounds.
What can statistics density not do?
It has limits, and the site’s pages are careful about them.
- It is not a promise. The SEO and GEO comparison describes the research paper’s methods as raising visibility by up to 40% on a benchmark, says the effect varied by subject area, and calls it evidence that how content is written changes how often it is used, not a figure to plan around.
- It does not replace SEO. The citation article says none of this is an argument for abandoning conventional practice. GEO techniques sit on top of clear structure, credible sourcing and relevance to the query.
- It does not guarantee a click. The comparison reports that people clicked a traditional result in 8% of visits when an AI summary appeared and 15% when it did not. A citation is not a substitute for traffic.
- It is one lever among several. The citation article reports that brand mentions correlate roughly three times more strongly with AI visibility than backlinks do. A page can carry excellent figures and still be passed over if nobody else mentions the name. The branded search page covers the other side of the name.
Read together, these point to a measured view. Adding sourced figures is a cheap, low-risk habit with a well-evidenced direction of effect. It is not a method with a fixed return.
How do you check whether it worked?
You cannot see it in a rank tracker, so you ask the questions yourself. The comparison says the practical method for most assistants is to ask a fixed set of real customer questions at regular intervals and record whether and how your brand is cited. It calls this slower and noisier than rank tracking, and the honest cost of working in a channel that does not report to you.
The brand article describes the set: ten to twenty-five realistic questions, run in clean sessions, recording the date, whether the business was named, what was claimed and which sources were cited. One run is an impression and not a measurement, so the same set is repeated monthly. To test a statistics pass, run the questions before you edit the page and again a month after.
What to do first
Pick one page that already performs well on a question a customer actually asks. Read it and underline every sentence that makes a claim without a figure, such as “many”, “growing”, “most” or “significant”. For each one, ask whether a real, checkable figure exists. If it does, replace the vague phrase with the figure and put the source in the same sentence. If it does not, leave the sentence alone, because an invented number is worse than a general one.
Then put the strongest figure and its source into the opening paragraph, and turn any comparison on the page into a labelled table. Run your fixed set of questions again next month and compare. The change will be modest and measurable, which is the right size for a first step. The full figures and their limits are in what gets content cited in AI answers, and the order of work is in the SEO and GEO comparison.
FAQ
Questions about Statistics Density
What is statistics density?
It is how much specific, quantitative data a page carries compared with general assertion. A page that says adoption is increasing has low statistics density. A page that gives a specific, sourced percentage has more. The citation article treats it as one of the signals AI systems respond to, alongside source credibility.
Does adding statistics to a page make it more likely to be cited by AI?
In the study the citation article describes, adding statistics gave the largest single improvement of the nine techniques tested, a 41% increase in AI visibility. Combining it with fluent, well-structured writing gave the largest effect of any pairing. It is a result from a research benchmark, not a promise for any one site.
What actually gets Content cited in AI-generated AnswersSEO vs GEO: What changes and what doesn't
Is a longer page more likely to be cited?
Not on length alone. The citation article reports that simply adding more words produced no improvement, and that the signal AI systems respond to is data density and source credibility. Keyword stuffing gave negligible or negative effects.
Is statistics density the same as keyword density?
No, and they point in opposite directions. Keyword density is how often a target phrase is repeated, and the study found packing content with repeated phrases produced negligible or negative effects. Statistics density is how much specific, checkable information a page carries, and it produced the largest single gain.
Why does a figure need its Source next to it?
The SEO against GEO review says an assistant can only repeat a number with confidence if the page shows where it came from, and a reader checking it needs the same. Assistants are built to give answers grounded in sources they can point to, so a figure with its origin beside it is easier to use and safer to repeat.
Do the statistics have to be your own?
No. Citing credible external sources was one of the three techniques with the largest gains, and it improved visibility by 115% on lower-ranked content. Your own original figures in a labelled table are linked to more citations than the same claim in prose, according to a guide the ranking article cites, but that is an addition and not a requirement.
What actually gets Content cited in AI-generated AnswersWhy ranking on Google isn't enough anymore
Which pages should get statistics first?
The citation article says to start with pages that already perform reasonably well under conventional SEO, since they are best placed to benefit, and to add specific, sourced statistics and credible citations to them first. Lower-ranked pages are worth the same pass, because citing external sources gave them the largest gain in the study.
Can a Business rely on the 41% figure?
Treat it as evidence of direction, not a number to plan around. The SEO against GEO review describes the research paper's methods as raising visibility by up to 40% on a benchmark, says the effect varied by subject area, and says it is not a promise for your site. What it shows is that how content is written changes how often it is used.
SEO vs GEO: What changes and what doesn'tWhat actually gets Content cited in AI-generated Answers
What it means for a Business
A business does not need more content to benefit. The citation article says adding words alone produced no improvement, and that a sourced statistic or a credible citation is an addition to pages that already exist.
Ready to Put This to Work?
Tell us where your team is with AI and we will tell you honestly what would make the biggest difference.